
What a stock index is (and why the Nasdaq is your playing field)
If you trade Nasdaq futures —NQ or its micro, the MNQ— understanding how an index breathes changes how you read the chart.
An index is a thermometer. It doesn't measure one company: it measures the group. It rises or falls based on how its member companies behave and, above all, on how much each one weighs. In the big indices, a handful of giants can move the index on their own — which is why you sometimes see it green while most stocks are red.
First practical lesson: when you trade the Nasdaq, you're mostly trading the pulse of a few huge tech companies.
What moves an index
Macro data
Inflation, employment, retail sales, GDP… The U.S. releases (usually at 2:30pm Madrid time) are the ones that move the Nasdaq the most.
Central banks
What the Federal Reserve does —and says— about interest rates is probably the number-one factor over the medium term.
Earnings & sentiment
The quarterly results of the index's big names, market mood and geopolitics: fear and euphoria move price as much as the numbers.
The big U.S. indices. Three names take almost all the attention — and the last one is ours.
S&P 500
The 500 large U.S. companies. The world's benchmark index.
Dow Jones
30 historic companies. The oldest of them all.
Nasdaq
The technology index par excellence, and one of the most volatile and directional. This one is ours.
From index to futures: NQ and MNQ. The NQ (E-mini Nasdaq-100) and the MNQ (Micro E-mini) are futures that track the Nasdaq-100 index: you trade its movement without buying any stock. The difference is size. At JMG Indicators we work on micro (MNQ) because it lets you size positions precisely and manage risk to the millimeter — which is what separates those who last from those who don't. The suite works the same on micro and mini.
Why it matters to you. The same volatility that gives you clean, directional moves is the one that wipes you out if you enter without structure. That's why it makes sense to trade with tools that show you where institutional money, structure and value are — instead of improvising candle by candle. But no tool replaces a plan, a key time marked on the clock, and risk management you respect even when it hurts.
Educational content by JMG Indicators. This is not financial advice or an investment recommendation. Trading futures carries a high risk of capital loss.
One day, one indicator
Every day we explain one indicator in plain language: what it is, why everyone watches it and how it looks on the chart. Here is the full series to review whenever you like.
What is the VWAP and why does everyone watch it?
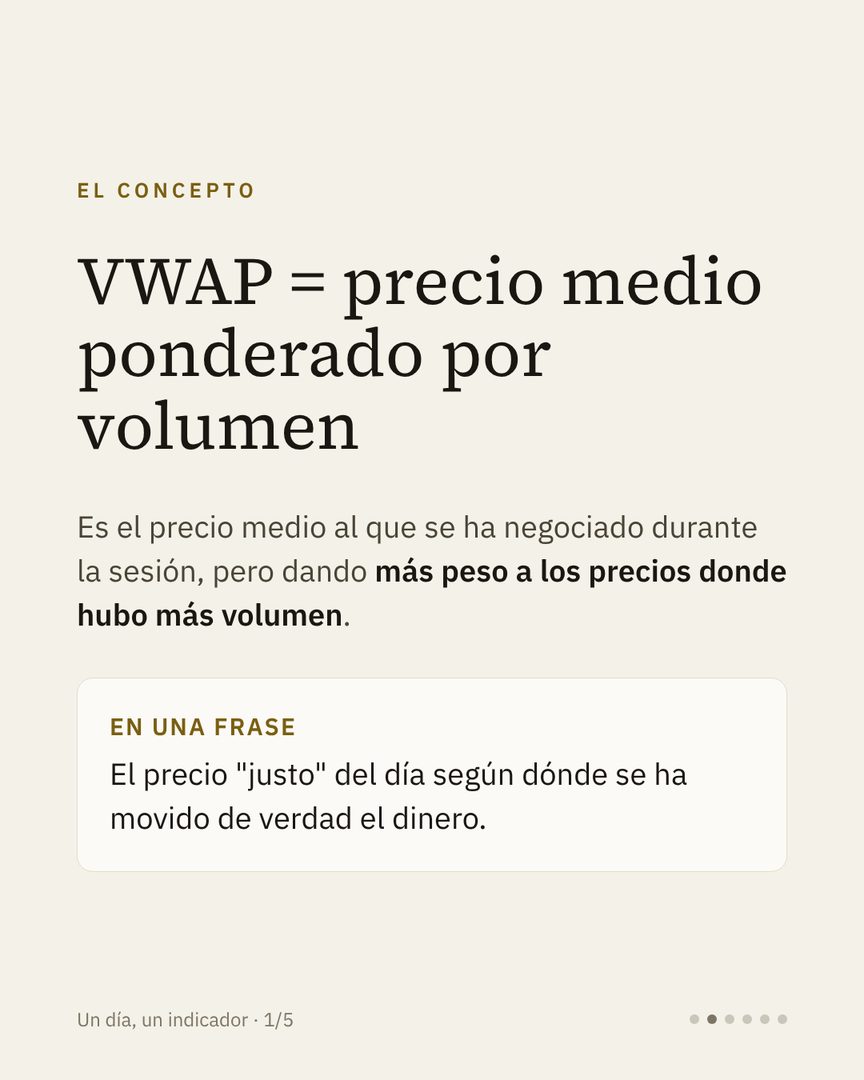
VWAP = volume-weighted average price. It's the average price traded during the session, giving more weight to the prices where more volume traded. In one sentence: the day's "fair" price, based on where the money actually moved.
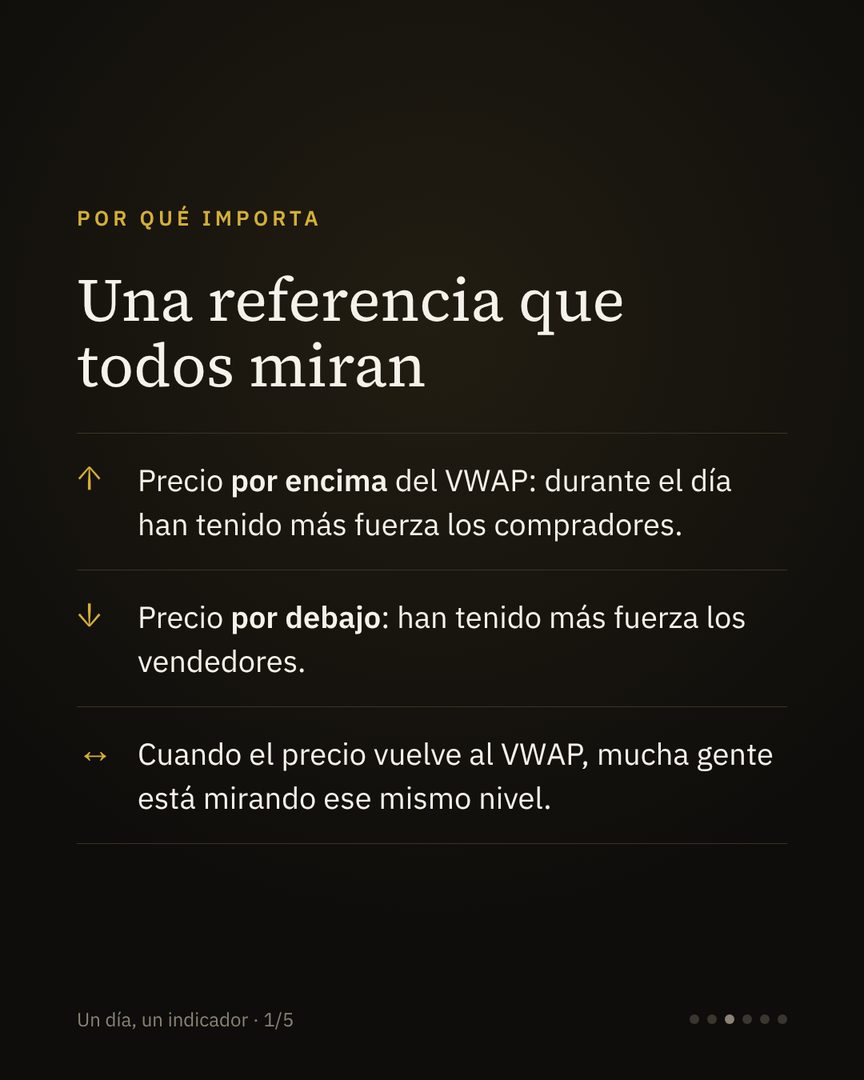
Why it matters. It's a reference used by everyone from large funds to independent traders:
- Price above the VWAP: buyers have had the upper hand during the day.
- Price below: sellers have had the upper hand.
- When price returns to the VWAP, a lot of people are watching that same level.
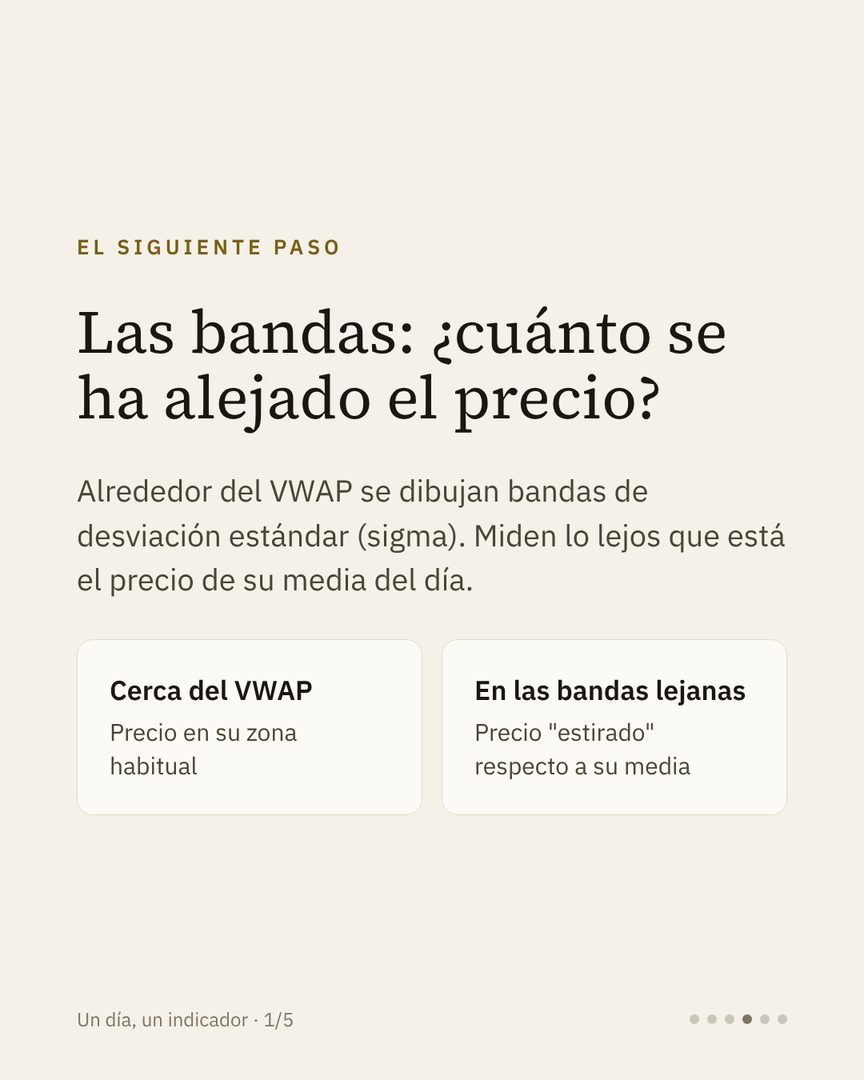
Next step: the bands. Standard deviation (sigma) bands are drawn around the VWAP to measure how far price is from its daily average. Near the VWAP, price is in its usual zone; at the outer bands, it's "stretched".
JMGVWAPSigma draws all of this in your NinjaTrader 8.
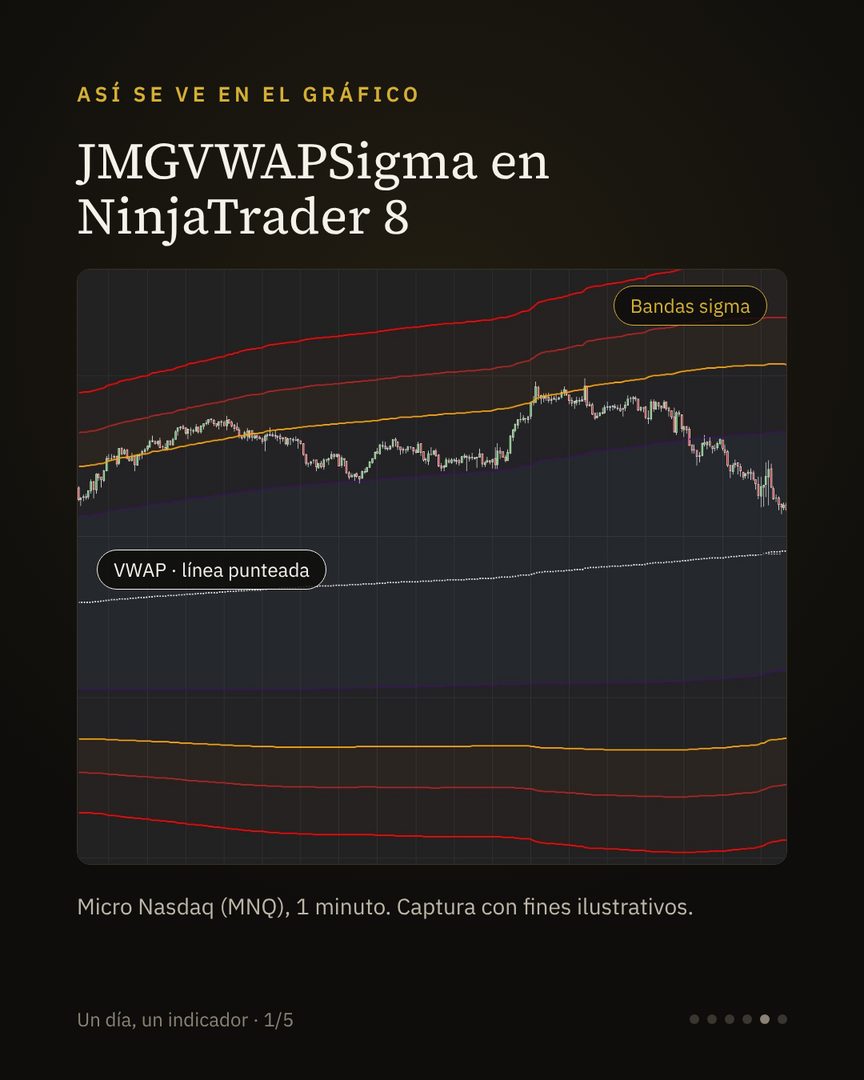
Click any image to enlarge it (images in Spanish). MNQ screenshot for illustrative purposes.
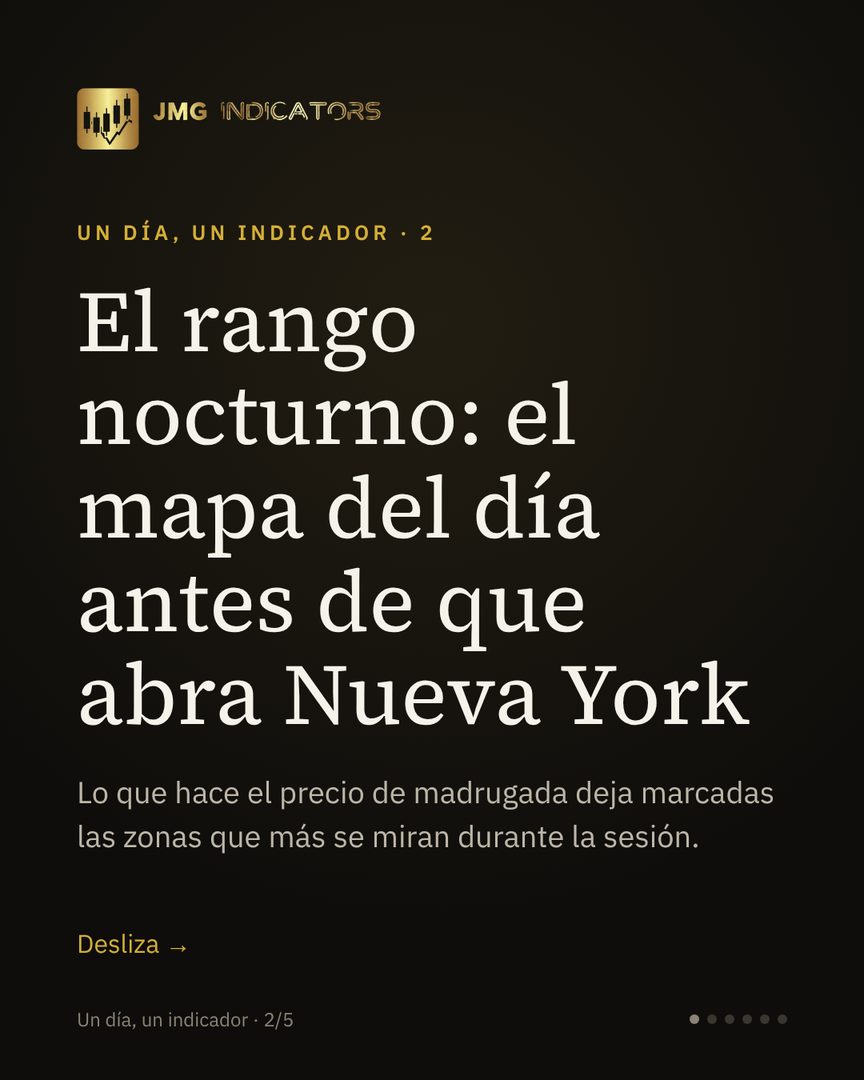
The overnight range: the day's map before New York opens
Two ranges worth marking. Futures like the Nasdaq trade almost 24 hours a day. Before the New York open, price has already drawn its own playing field:
- Overnight range: the high and low price makes before the open.
- Initial Balance (IB): the range of the first hour of the main session.
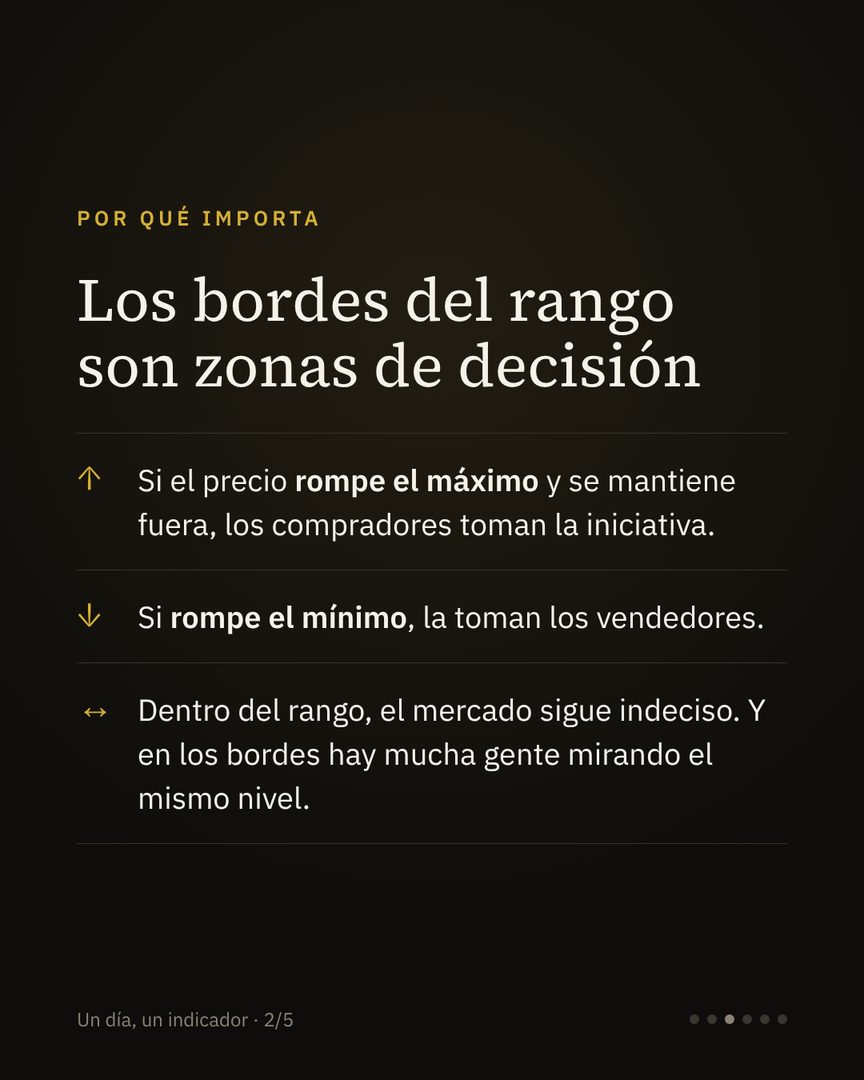
Why it matters. The edges of the range are decision zones. If price breaks the high and holds outside, buyers take the initiative; if it breaks the low, sellers do. Inside the range, the market is still undecided, and many people are watching the same edges.
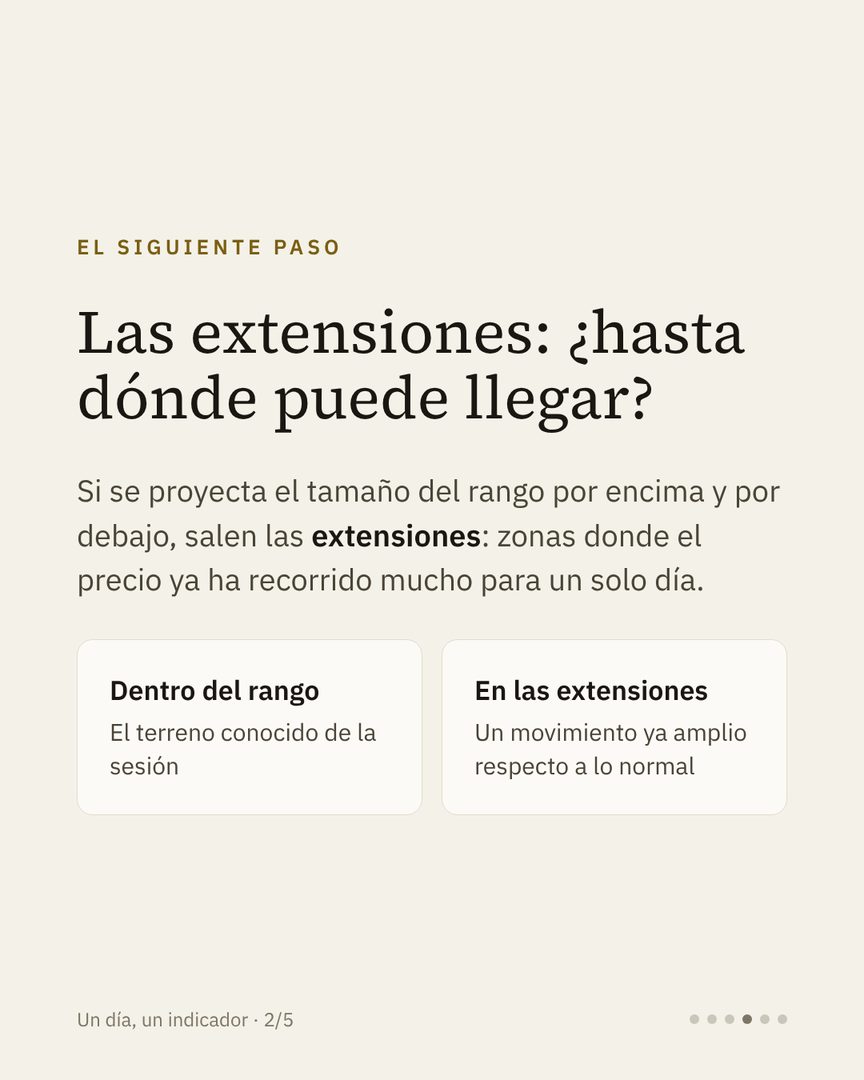
Next step: the extensions. Project the size of the range above and below and you get the extensions: zones where price has already travelled a lot for a single day.
JMGRangeSigma draws all of this in your NinjaTrader 8, with statistics for every session.
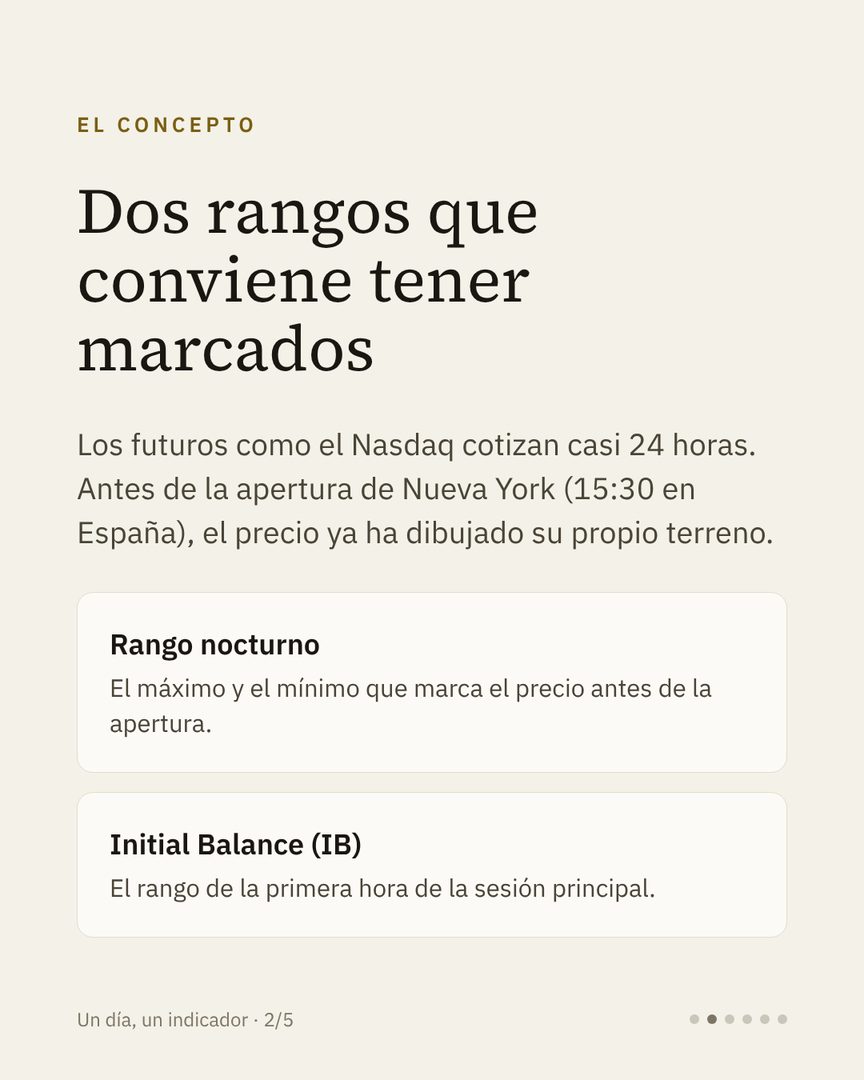
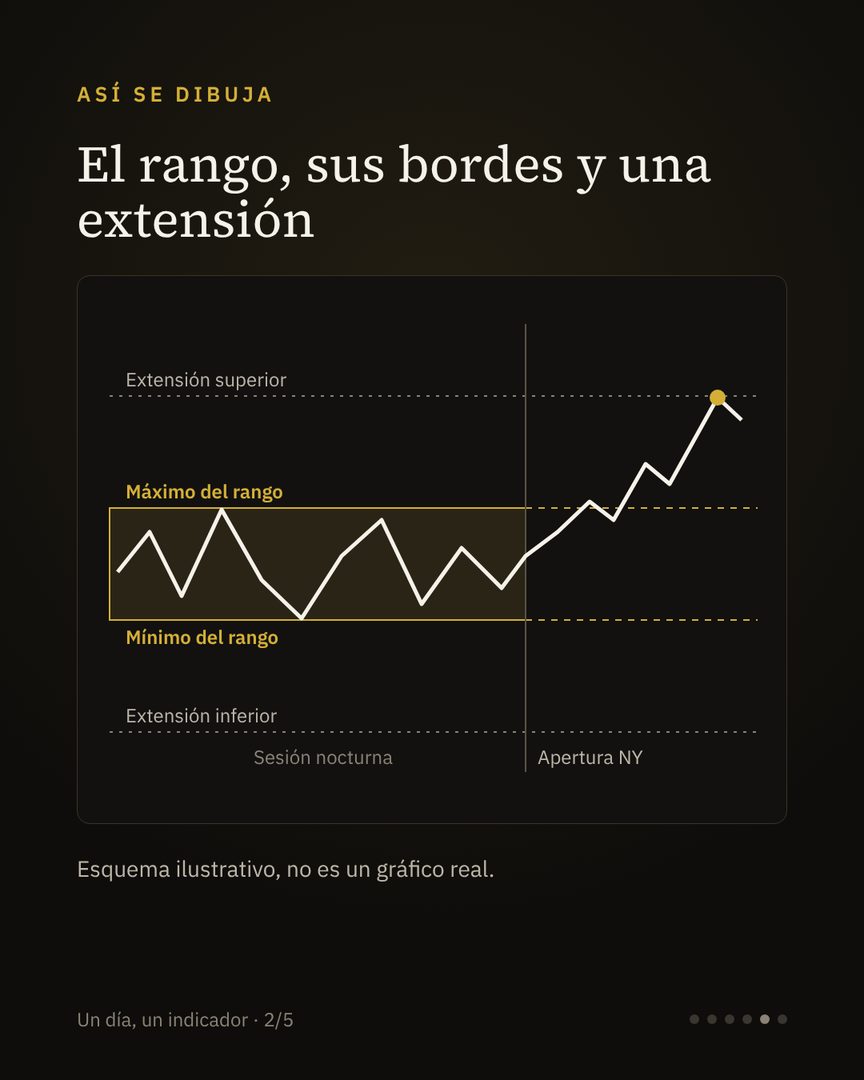
Click any image to enlarge it (images in Spanish). The chart is an illustrative diagram.
Market structure: the skeleton of price
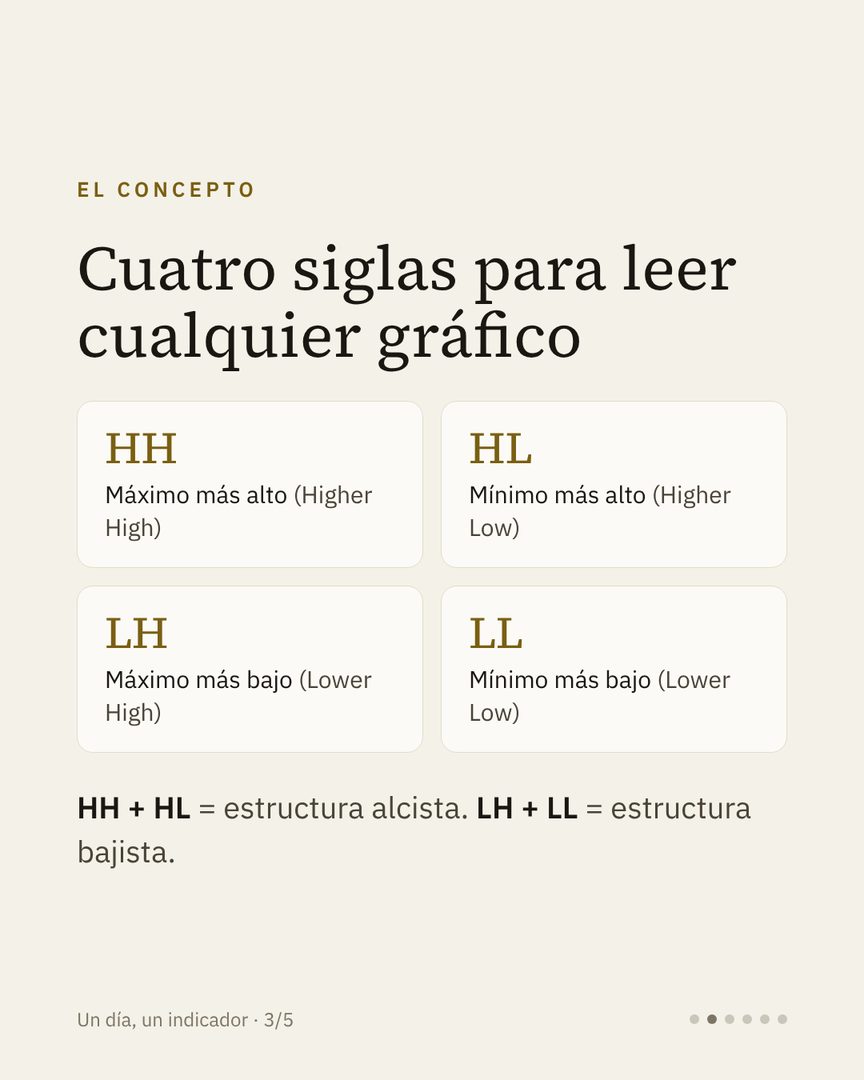
Four acronyms to read any chart. Before any indicator, the chart already tells you who is in control. You just need to read its highs and lows:
- HH: Higher High. HL: Higher Low.
- LH: Lower High. LL: Lower Low.
HH + HL = bullish structure. LH + LL = bearish structure.
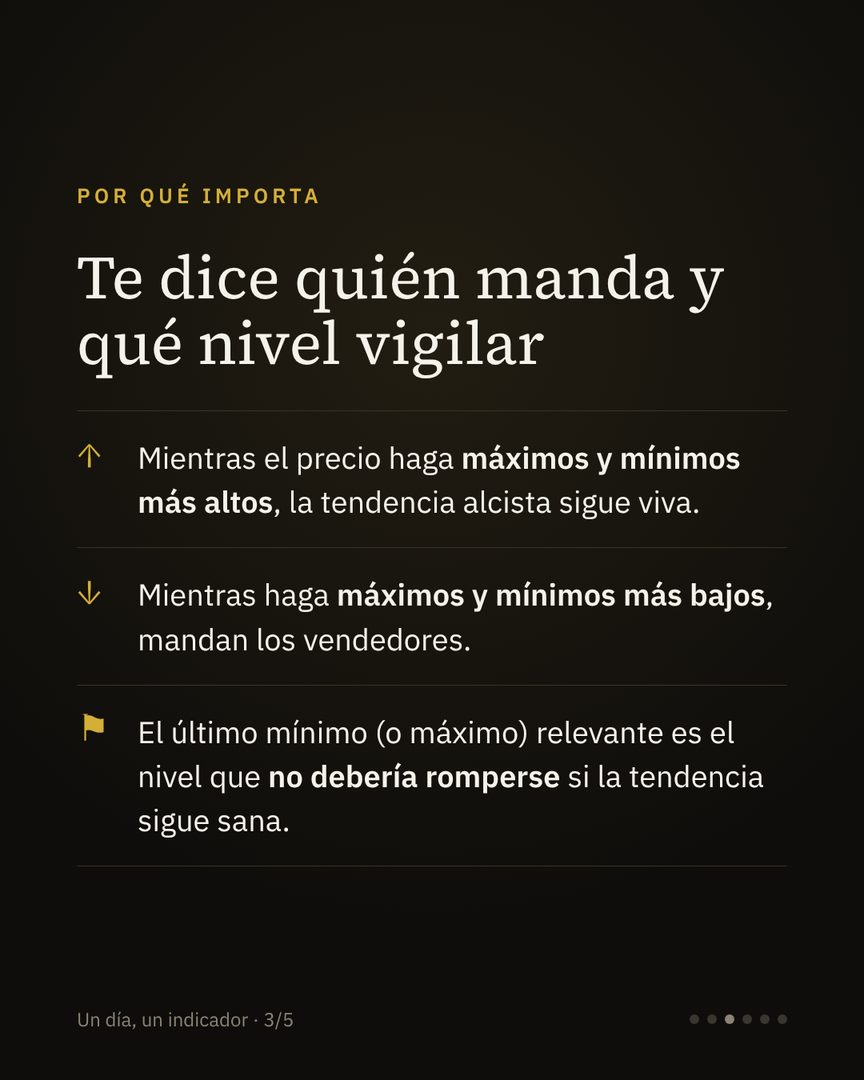
Why it matters. As long as price keeps making higher highs and higher lows, the uptrend is alive; while it makes lower ones, sellers are in control. And the last relevant low (or high) is the level that shouldn't break if the trend is healthy.
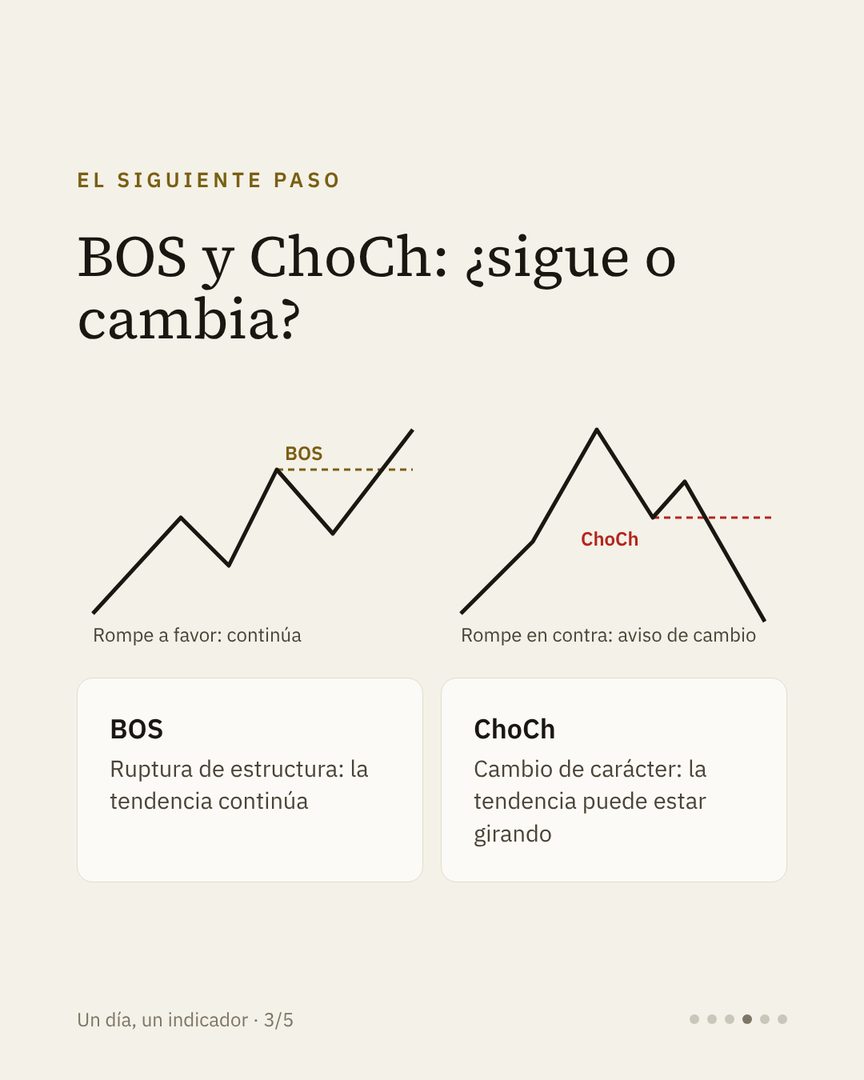
Next step: BOS and ChoCh. A BOS (break of structure) breaks in the direction of the trend: it continues. A ChoCh (change of character) breaks against it, usually the last higher low or lower high: a warning that the trend may be turning.
JMGStructure marks all of this in your NinjaTrader 8, confirmed on candle close and without repainting.
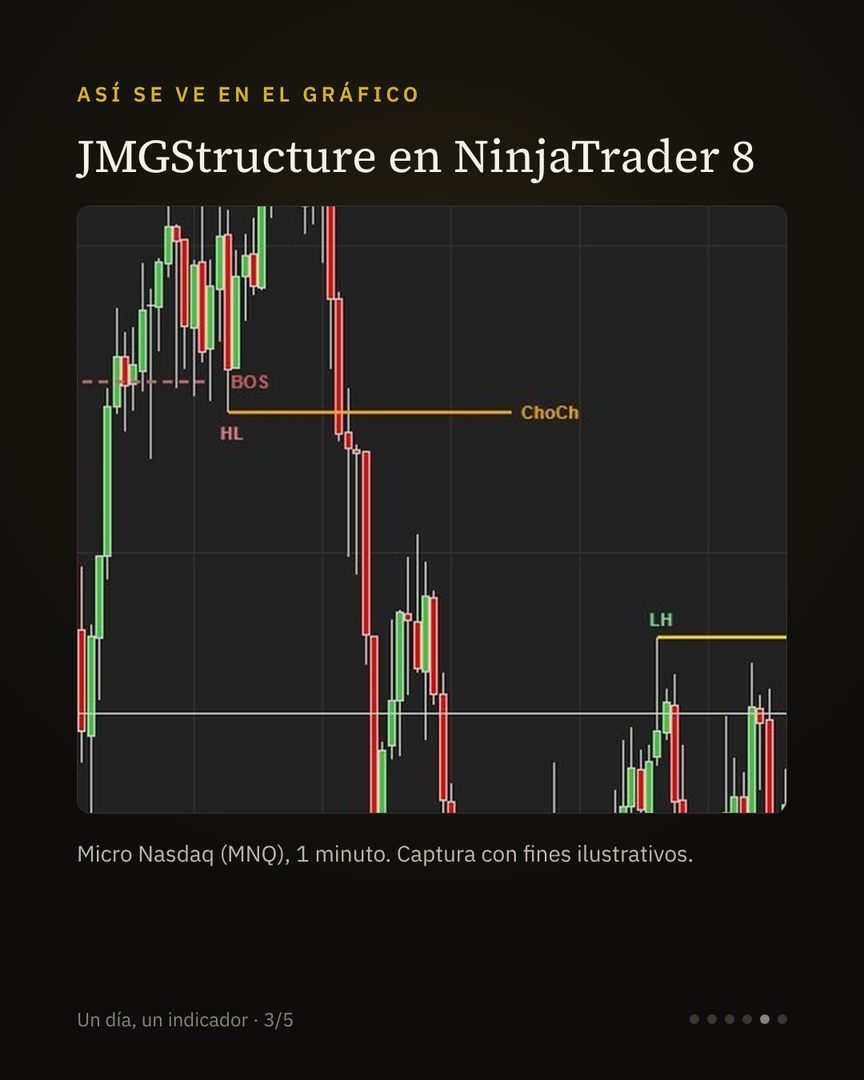
Click any image to enlarge it (images in Spanish). MNQ screenshot for illustrative purposes.
Educational content by JMG Indicators. This is not financial advice or an investment recommendation. Trading futures carries a high risk of capital loss.